
Type of solution
Dashboard or visualization
A Power BI, Tableau, ArcGIS or custom dashboard, map or chart others can rebuild.
1 use caseRefine this one in use cases →
Use cases tagged Dashboard or visualization
 Open source
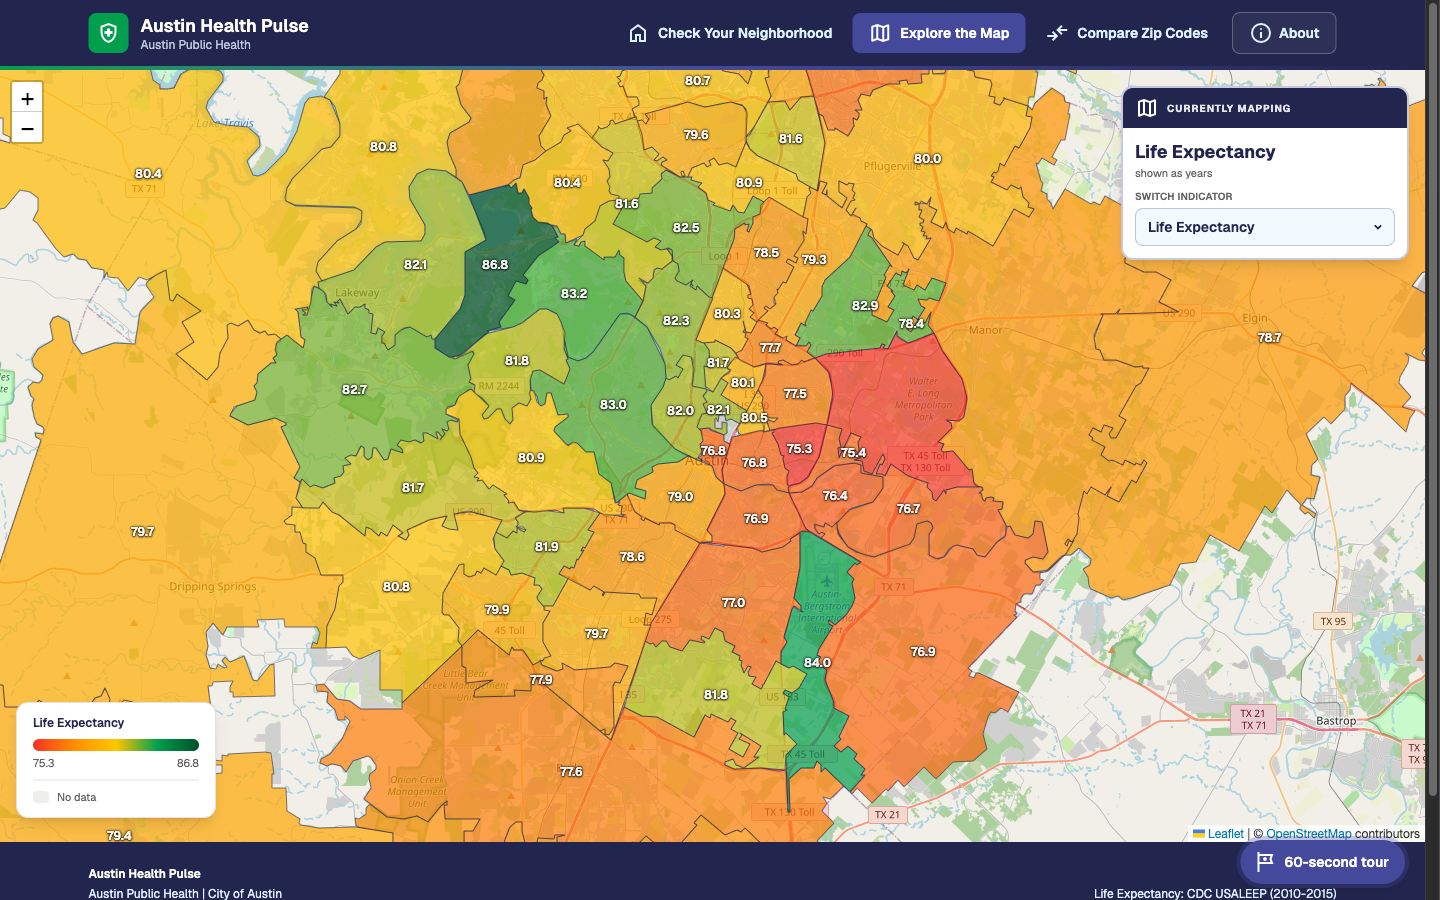
Austin Health Pulse — life expectancy explorer by ZIP code
Result in one line: Built in about 12 staff hours, against a typical agency estimate of 6–8 weeks
An interactive map and calculator showing how life expectancy and health indicators differ across Travis County's 63 ZIP codes, with an 11.6-year gap between the longest- and shortest-lived.
- Dashboard or visualization
- Data pipeline or integration
Skills needed to set it up: Developer Readiness: Needs customization Data it touches: Public data only Who sees the output: Public-facing